
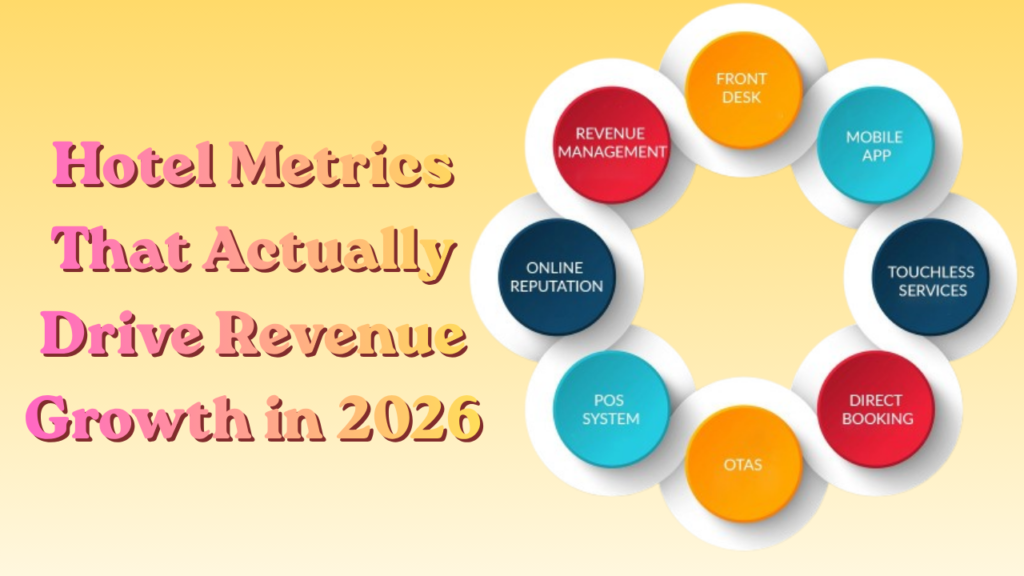
Every hotel team checks a few numbers each morning: occupancy, ADR, maybe RevPAR. These figures matter, but they only cover room performance. They miss guest spending, space usage, and pricing speed, all of which shape how much revenue a property actually earns. Properties pulling ahead right now track a wider set of hotel metrics. They observe the responsiveness of pricing to demand, the amount spent by each guest during their stay, and the performance of non-room-based spaces. When you put these numbers side-by-side, you can see the difference between the average and the best-performing hotels.
| Hotel metrics are a set of indicators that quantify data used by hoteliers to analyze financial performance, operational efficiency, and value of the guest. In addition to RevPAR and ADR, the best-performing properties have started to monitor rate responsiveness, revenue per available guest (RevPAG), conversion of upsell by stage of journey, revenue per available square meter (RevPAM), and patterns of booking lead time. |
Why RevPAR Alone Cannot Measure Guest Value
RevPAR is calculated as the division between the room revenue and the available number of rooms; therefore, it is only able to provide a performance of the number of rooms that do well, rather than the amount spent by guests in general. Even with a high RevPAR, the property will lose huge amounts of money when guests miss out on upsells or on-site services.
The result of this is that revenue teams had to embrace Revenue Per Available Guest or RevPAG. This measure includes the additions of room revenue, food and beverage expenditures, spa charges, parking fees, and purchase of upgrades, and then dividing the figure by the number of guests. It, therefore, provides a more practical question: how much your individual guests are actually spending, as opposed to how many rooms you are selling.
For instance, one US hotel group grew its average upsell value by $76 per booking after shifting focus toward guest-wide spending instead of room rate alone. That growth never shows up in RevPAR, yet it directly boosts total revenue.
Faster Pricing Decisions Through Rate Responsiveness
Rate responsiveness is a measure of the distance between a signal of demand and your reaction in pricing. A rival lowers prices, a hometown event is announced, or bookings just start to pick up. The faster your rates adjust, the less margin you lose.
Pricing reviews that are done manually, once or twice a day, cause long delays in posting to market changes and updating rates. In that delay, you set a price relative to what was demanded yesterday rather than being at a price relative to today. Automated systems seal this loophole, as they constantly consider rival rates, local events, as well as booking pace. There are revenue platforms which run transactions of much more than 100 million pricing decisions per day, which no manual team could handle.
A simple question helps here: what share of your rate changes happen through automation versus manual review? As that share grows, your pricing stops reacting late and starts leading the market instead.
Guest Journey Upsells and Where They Convert Best
Most hotels report upsell revenue as one combined number. This hides where conversions actually happen, so teams cannot tell which channel deserves more investment. Breaking upsells into journey stages solves this problem and shows exactly where guests respond best.
- Booking Engine Upsells: Guests add upgrades or extras while completing their reservation. This stage captures interest early, before arrival expectations are set.
- Pre-Arrival Upsells: Within roughly 72 hours of check-in, guests receive offers through email or a digital portal. This window often sees strong conversion because travel plans feel more real at this point.
- Check-In Upsells: This is done at the front desk or via a self-service kiosk. The digital check-in channels produce three times the rate of upsell compared with front-desk interactions, and 70% greater upsell revenues per check-in. Then, in case the bulk of your upsell business is at the front desk, your pre-arrival and online channels may require additional focus.
Real examples support this pattern clearly. One boutique property saw an 8.5% upsell conversion rate through online check-in, adding roughly $73 per reservation. Another hotel group added $132 in average value per reservation through similar digital touchpoints. These numbers show that channel choice, not just offer quality, shapes upsell performance.
Measuring Non-Room Revenue With RevPAM
RevPAR does not provide any visibility of meeting rooms, event space, or co-working space. Revenue Per Available Meter (revPAM) bridges this difference by utilizing RevPAR reasoning to the overall footprint of the property, not just guest rooms.
RevPAM provides you with a way to compare performance of a meeting room with a suite, co-working desk with unsold event space, etc. In the absence of this measure, non-room inventory tends to remain unpriced and unused when guest demand toward non-room inventory continues to rise.
More than half of all guests now want access to services like co-working spaces, bike rentals, or guided activities. However, not the majority of hotels have developed these into an official pricing strategy. RevPAM provides revenue teams with a mutually agreed framework to price, monitor, and optimize this commonly neglected inventory.
Booking Lead Time and Pickup Patterns
Lead time shows how far ahead guests book. Pickup pace shows how quickly those bookings convert once inventory opens. Together, they reveal whether demand is priced correctly or whether rooms sell too early at rates that should have stayed higher.
Segmenting this data by channel makes the picture sharper. OTA bookings typically arrive later and generate lower net revenue after commission fees. Direct bookings usually arrive earlier and produce higher net revenue per room. One property grew total revenue by 38% in a single year simply by shifting focus toward direct channel performance and ancillary capture instead of relying on room rate hikes alone.
If your direct booking lead time keeps shrinking, that channel needs attention before your RevPAR numbers start slipping too.
Hotel Metrics Comparison
| Metric | What It Measures | Best Used For |
| Occupancy Rate | Percentage of rooms sold | Basic demand tracking |
| ADR | Average revenue per sold room | Room pricing performance |
| RevPAR | Room revenue per available room | Overall room revenue efficiency |
| RevPAG | Total guest spend per guest, across the stay | Full guest value measurement |
| RevPAM | Revenue per available square meter, full property | Non-room space performance |
| Rate Responsiveness | Speed of pricing reaction to demand | Dynamic pricing effectiveness |
| Upsell Conversion by Stage | Conversion at booking, pre-arrival, check-in | Optimizing digital vs front-desk upselling |
| Booking Lead Time | How far ahead guests book | Demand forecasting by channel |
Hotel Performance Data
| Data Point | Figure |
| Pricing calculations processed daily by a leading RMS | Over 130 million |
| Average upsell value growth after guest-wide focus | $76 per booking |
| Upsell rate via digital portal vs front desk | 3x higher |
| Upsell revenue per check-in via digital channels | 70% more |
| Upsell conversion via online check-in (boutique example) | 8.5% |
| Average value added per reservation (hotel group example) | $132 |
| Guests wanting non-room services like co-working | Over 50% |
| Total revenue growth after direct channel focus | 38% in one year |
Mistakes Hotels Make While Tracking Metrics
Even experienced revenue teams fall into predictable traps. Spotting these early saves time and prevents inaccurate reporting later.
- Relying on Room Metrics Alone: Teams track RevPAR without pairing it with RevPAG, so they miss ancillary revenue entirely.
- Reviewing Rates on a Fixed Schedule: Daily or twice-daily manual reviews create long lags between demand shifts and rate updates.
- Combining All Upsell Revenue Into One Number: This hides which stage, booking, pre-arrival, or check-in, actually drives conversions.
- Ignoring Non Room Inventory: Meeting rooms and co-working spaces often go unpriced simply because no one measures them.
- Treating All Booking Channels the Same: OTA and direct bookings behave differently, so lumping them together skews lead time analysis.
Practical Steps to Improve Hotel Metrics Tracking
Fixing these gaps does not require a full system overhaul. It mostly requires shifting focus toward the numbers that reflect real guest value.
- Pair Room and Guest Level Metrics: Track RevPAR alongside RevPAG so you capture both room and ancillary revenue together.
- Automate Rate Reviews Where Possible: Shrinking the gap between demand signals and pricing action protects margin during busy periods.
- Break Upsell Reporting Into Stages: Report booking engine, pre-arrival, and check-in upsells separately so you know where to invest.
- Apply RevPAM to Every Non Room Space: Price and track meeting rooms, event space, and co-working areas the same way you price guest rooms.
- Segment Lead Time by Channel and Guest Type: This reveals which channels need earlier pricing adjustments and which ones can wait.
Final Thought
Hotel metrics keep evolving because guest spending keeps evolving too. Products that measure guest value throughout the entire stay, price rooms using real-time demand, and consider every piece of their footprint as revenue-generating space are always ahead of those that continue to measure occupancy and ADR separately. None of this needs a complex system overhaul. It simply needs a shift toward the numbers that actually show where revenue grows or slips away.
FAQs
What are hotel metrics?
Hotel metrics are numbers that measure a property’s financial and operational performance.
What is the difference between RevPAR and RevPAG?
RevPAR measures room revenue only, while RevPAG measures total guest spend across the stay.
Why does rate responsiveness matter?
Slow pricing reactions cause hotels to lose margin during sudden demand shifts.
What does RevPAM measure?
RevPAM measures revenue generated per square meter across a property’s full footprint.
Where do hotel upsells convert best?
Digital channels like kiosks and online check-in convert upsells far better than front-desk interactions.
How does booking lead time help pricing?
It shows how early guests book, helping teams price demand more accurately by channel.
Do all hotels need RevPAM?
Only properties with non-room inventory like meeting rooms or event spaces benefit from it.
How often should hotel metrics be reviewed?
Pricing-sensitive metrics need daily review, while others work well on a weekly basis.
Why does automation matter in pricing?
Automation tracks demand signals continuously, something manual teams cannot match in speed.
What is the biggest mistake hotels make with metrics?
Relying only on RevPAR while ignoring guest spend, space performance, and channel data.
Read More: Hotel Average Rate Index: The Metric Behind Smarter Rate Decisions